CA House Price Predictor
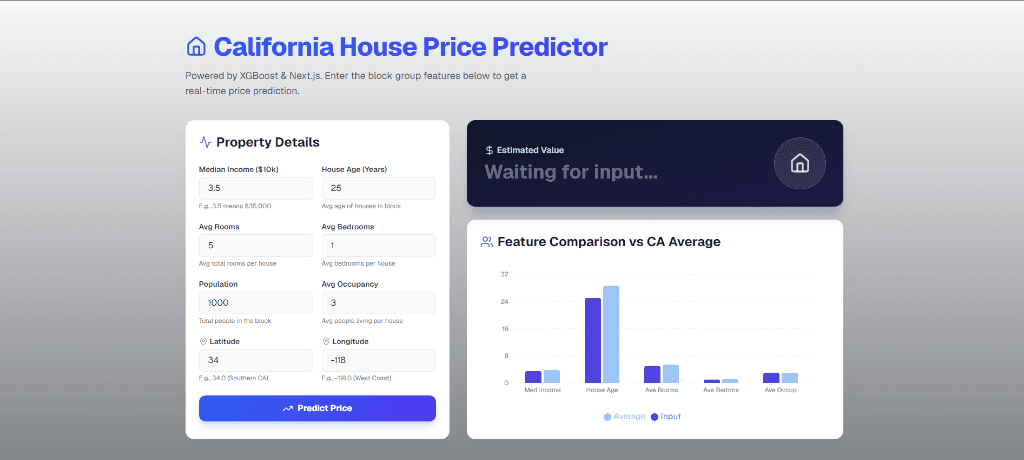
A full-stack ML application where users enter block-group features (income, age, rooms, location) and get instant XGBoost price predictions with a Feature Comparison vs CA Average chart - deployed on Vercel.
Tech stack
Impact
Problem Statement
House price estimation is a classic regression problem, but the challenge here was bridging the gap between a trained ML model and a polished, real-time web UI - making predictions accessible to non-technical users with live feature comparison.
Dataset
California Housing Dataset (20,640 block-group observations from the 1990 census): median income, house age, average rooms/bedrooms, population, average occupancy, and lat/lon coordinates.
Architecture
XGBoost regressor trained in Python, serialised, and served via a FastAPI backend. Next.js front end renders a two-panel layout - a form for feature inputs and a live bar chart comparing user inputs vs California averages via Recharts.
Model Selection
XGBoost outperformed Linear Regression, Ridge, and Random Forest on RMSE and R². It handles the non-linear interaction between income, location, and occupancy density far better than linear baselines.
Training Process
Feature engineering: log-transform of income; geographical clustering of lat/lon. Hyperparameter tuning via RandomizedSearchCV on n_estimators, max_depth, learning_rate, and subsample. Final model exported with joblib.
Evaluation Metrics
Results
Live at california-house-price-prediction-xi.vercel.app - enter any block-group features and get an instant predicted median house value with a dynamic feature comparison chart.
Key Learnings
- 1Bridging a Python ML model to a Next.js UI requires a clean API layer.
- 2Visual feature comparison (user vs average) significantly improves prediction interpretability.
- 3XGBoost's feature importance makes the model explainable to non-technical stakeholders.
Want to dig deeper?
Explore the code, or get in touch if you'd like to talk through the approach.